You are here: Reference Content > Methods > Study Design
Prior to conducting a non-targeted analysis (NTA) study, researchers should create a study design that will support their stated hypotheses and/or research questions. In analytical chemistry, study design is typically the compilation of parameters and procedures used to perform and qualify a set of measurements. Thus, study design may cover all aspects of NTA, including (but not limited to): sample preparation, selection of quality control materials, preparation of samples, instrumental analysis methods and parameters, data reduction and analysis methods, and data interpretation approaches. We also note that study design should intentionally incorporate quality assurance and quality control (QA/QC) approaches and yield the necessary data to enable performance assessments after data acquisition and analysis is complete. Ultimately, it is important that all study conclusions be supported by and within the scope of the study design. For example, the boundary of the non-targeted analysis could be described with respect to the detectable chemical space, limitations/biases/uncertainties of the measurement(s), and/or the confidence in identification. Further discussion of the boundary is provided in QA/QC Metrics.
NTA terminology and protocols can be esoteric to non-practitioners, such as proposal reviewers and journal editors, and are even used differently across NTA research groups. We have defined specific terminology here and throughout the other sections of the website to enable clear communication, and we encourage researchers to clearly define and describe their study design so that the work is repeatable and the audience can understand the limitations and biases of the results.
In this section, we focus on three portions of study design (defining the Objectives & Scope, reporting the Sample Information & Preparation, and use of QA/QC Spikes & Samples) that lay the foundation for subsequent Data Acquisition, Data Processing & Analysis, and Results interpretation (including reporting of Data Outputs and evaluation of QA/QC Metrics).
Objectives and Scope
You are here: Reference Content > Methods > Study Design > Objectives and Scope
To enable discussion and reporting of the study objectives and scope, we first present definitions of suspect screening analysis (SSA) and non-targeted analysis (NTA), followed by a comparison to targeted analysis and a discussion of the practical usage of the terms. We then use a series of examples to demonstrate how researchers could report the scope of their study design with respect to suspect screening and NTA.
Defining Suspect Screening Analysis and Non-Targeted Analysis
Suspect screening analysis (SSA, also simply “suspect screening”) and non-targeted analysis (NTA) are two inter-related techniques for the evaluation of the chemical content of a sample, and can be used to describe the researcher’s approach to data acquisition and/or data analysis methods. The confidence level of a presumed identification by either suspect screening or NTA will vary based on the amount of information available, including but not limited to molecular formula identification, fragmentation spectra, retention time, isotopic distribution, and library match (discussed further in Annotation & Identification).
Note: The definitions of suspect screening and non-targeted analysis, and how these approaches can be differentiated, are still debated within non-targeted analysis communities. In the near future, members of BP4NTA will be critically analyzing the current literature with regards to these definitions and present a summary of their findings. For the currently-presented reference content, the below definitions will be used.
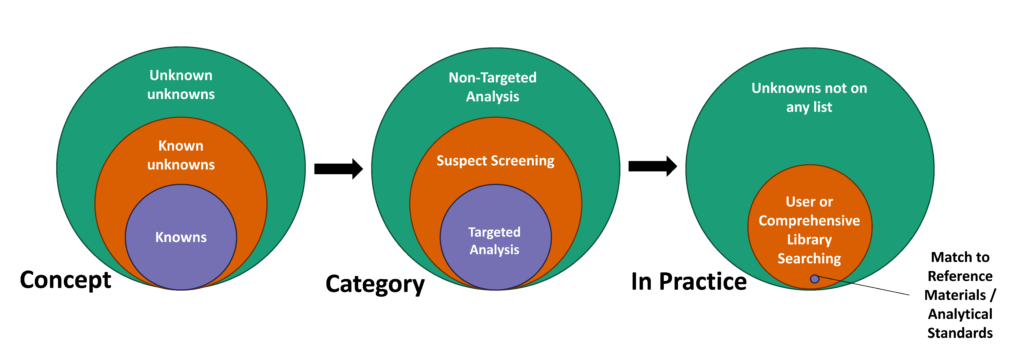
Suspect screening analysis (SSA) is the identification of chemicals and/or chemical classes detected by an instrument, typically a mass spectrometer, by comparison to a predefined user list or library containing known chemicals of interest. Use of a predefined chemical library essentially acts as a funnel, tightening the scope of the study. This funnel may be applied at the data acquisition stage (i.e., by limiting the data acquisition method to only capture the contents of the suspect screening list) and/or at the data analysis stage (i.e., by designing the data analysis scheme to only search for, annotate, and identify the contents of the suspect screening list). The choice of a suspect screening list may be guided by prior knowledge of expected contaminant class(es) or researcher interest in specific contaminant class(es).
Non-targeted analysis (NTA), also referred to as “non-target screening” and “untargeted screening,” among several other related terms, is a theoretical concept that can be broadly defined as the characterization of the chemical composition of any given sample without the use of a priori knowledge regarding the sample’s chemical content. The resulting detections may be used to classify samples (using the entire chemical profile), and/or subsequent analyses may focus on the identification of individual chemicals. Typically, “true” NTA annotation and identification efforts are focused on chemicals that are unknown from two perspectives: 1) the chemicals are not included in established libraries or databases and 2) presence of the chemical in the sample is not known a priori. Although the chemical scope of NTA is not limited by a predefined library (as for suspect screening), the NTA data acquisition process and the NTA data processing scheme may still be limited by specific operating conditions or method choices that prevent the detection of some chemicals (for example, due to concentration or physical properties such as molecular weight, boiling point, polarity, etc.).
The results of NTA and SSA are limited by the chemical space of the analysis. Chemical space is defined as the physicochemical property space spanned by the detectable and identifiable chemicals in a given NTA study, as defined by method, analytical, and data processing choices (although further exploration of this definition is on-going within BP4NTA working groups).
Differentiating Targeted Analysis, Suspect Screening, and Non-Targeted Analysis
SSA and NTA differ from targeted analysis because positive controls (i.e., authentic standards for all chemicals known to be present in or whose presence is of interest in the samples of interest) are not necessarily analyzed alongside the test samples. Likewise, SSA differs from NTA (with respect to compound identification) because the chemical scope of a suspect screening analysis is limited by a predefined library (whether the library is small and tailored to specific chemical classes, or large and comprehensive). The differences between targeted analysis, SSA, and NTA are represented visually by Figure 1.1.
In practical usage, a single workflow can be applied to capture targeted, suspect screening and/or non-targeted analysis in one analysis. Furthermore, we note that the term “NTA” may include suspect screening and “true NTA”. For example, the data acquisition scheme may be operated comprehensively (i.e., maximizing the collected information via a non-targeted approach), but the data analysis scheme may be designed to first look for a defined list of chemicals in the data (i.e., suspect screening), followed by an attempt to identify any remaining unidentified features without the use of a defined list (i.e., “true” non-targeted analysis). Such a workflow could be expanded to include (quantitative) targeted analysis by the use of isotope-labeled internal standards and analysis of analytical standards alongside the samples of interest.
Due to this complementary usage of NTA and suspect screening across the data acquisition and data analysis methods, NTA is often used as a blanket term that encompasses both suspect screening and true NTA. We encourage researchers to clearly delineate the intended design and the scope of their Data Acquisition methods and Data Processing & Analysis methods with respect to suspect screening vs. non-targeted analysis; more information about suggested reporting on those methods (and information that could be considered to define scope) can be found in those respective sections.
Defining Objective and Scope with Respect to Targeted, Suspect Screening, and Non-Targeted Analysis
We encourage researchers to clearly delineate the intended objectives and scope of their study (including Data Acquisition methods and Data Processing & Analysis methods), with respect to targeted analysis, suspect screening, and non-targeted analysis. This effort should be performed during the experimental design phase (i.e., at the start of the study). More information about reporting on Data Acquisition and Data Processing & Analysis methods (and information that could be considered to define scope) can be found in the respective sections of this reference content. In Table 1.1 below, we compiled several representative references from the literature that encompass different scopes and provided a rationale for/description of the scope of each study with respect to targeted analysis, suspect screening, and/or NTA.
| Table 1.1: Defining Study Objective and Scope | |||||
|---|---|---|---|---|---|
| Study Objective | Study Scope | Targeted Analysis | Suspect Screening | NTA | Representative Study Reference |
| Analyze six specific phthalates in wastewater using reference standards | Targeted: 6 phthalates | X | Clara et al., 2010 | ||
| Detect 10 specific per- and polyfluoroalkyl substances (PFAS) and identify novel fluorinated compounds in surface water | Targeted: 10 PFAS reference standards NTA: Broader possible PFAS chemical space (e.g., limited by mass defect, etc.) | X | X | Strynar et al., 2015 | |
| Analyze plasma, evaluate all chemicals present in a library, and quantify 50 specific chemicals | Targeted: 50 chemical reference standards SSA: The selected user/comprehensive library NTA: Limited by sample prep methods and analytical method choices | X | X | X | Krauss et al., 2010 |
| Quantify 36 select PFAS and qualitative/semi-quantitative analysis of other previously reported PFAS | Targeted (for quantitative): 36 PFAS with available chemical standards SSA (for qualitative/semi-quantitative analysis): PFAS previously detected in AFFF formulations or AFFF-impacted sites | X | X | Mejia-Avendano et al., 2017 | |
| Investigate the complementarity of two spectral libraries, and apply the libraries for suspect screening in plasma and wastewater samples | SSA: Chemicals in two tandem mass spectral libraries – the WRTMD and the Eawag collection in MassBank | X | Oberacher et al., 2019 | ||
| Detect as many chemicals as possible in a sample from a comprehensive library | SSA: Comprehensive library (e.g. NIST), chemicals occurring in consumer products, limited by extraction and analysis methods | X | Phillips et al., 2018 | ||
| Analyze AFFFs and AFFF-impacted groundwater, apply suspect screening to identify known PFAS, apply NTA to identify novel PFAS | SSA: Previously reported PFAS NTA: Chemicals with mass defects and fragmentation patterns known to be characteristic of PFAS | X | X | Barzen-Hanson et al., 2017 | |
| Isolate a list of non-target (unidentified) features in water samples that represent a chemical signature for a coho mortality syndrome, and identify as many of those features as possible via suspect screening and NTA | SSA: Chemicals previously reported in stormwater and/or vehicle-related sources NTA: Structural analogs of chemicals identified via suspect screening (limited by sample prep and analysis methods to polar/semi-polar, ESI+ amenable compounds occurring in urban surface waters) | X | X | Peter et al., 2018 | |
| Comparison of different in silico fragmentation algorithms to aid in identifying unknowns from the CASMI challenge | SSA: possible candidate lists were distributed, MS/MS library comparisons NTA: in silico fragmentation and MS/MS similarity to improve compound identifications | X | X | Blaženović et al., 2017 | |
| Software was developed to identify erectile dysfunction drugs and their analogs | SSA: MS/MS spectral libraries NTA: MS/MS similarity searches to identify compounds not in available spectral libraries | X | X | Jang et al., 2019 | |
| Develop a statistical workflow to highlight molecular feature differences between sample groups | NTA: molecular differences were determined through differential analysis using an adjusted p-value <0.05 and >2 fold change between spiked and control sample groups. | X | Knolhoff et al., 2016 | ||
| Analyze the chemical impact of food handling techniques over time using different non-targeted screening strategies. | NTA: molecular networking to identify chemical classes, heat maps to visualize molecular changes over time, and principal coordinates analysis to observe sample trends. | X | Gauglitz et al., 2020 | ||
Sample Information and Preparation
You are here: Reference Content > Methods > Study Design > Sample Information and Preparation
Most samples of interest for NTA require processing prior to instrumental analysis. Common preparation steps (e.g, extraction, matrix clean-up, sample concentration, reconstitution, de-conjugation, and incubation) can affect the original composition of the sample by removing or introducing chemical components (Dimpe et al., 2016; Knolhoff et al., 2019; Knoll et al. 2020). The lack of a priori knowledge of chemicals detected with NTA makes assessment of sample preparation performance challenging. However, effective assessment and reporting of the selected sample preparation methods is crucial to understand the strengths and limitations of a given NTA study. Each decision and step along a sample preparation workflow can serve to both include certain compounds and exclude others, thus defining the maximum possible chemical space captured by the NTA study.
This section outlines a series of important parameters relevant to sample information, sample preparation, and use of blanks that should be considered during study design and reported in an NTA manuscript (summarized in Table 1.2). This list is not comprehensive, and we do not provide a detailed description of each different preparation technique. Thus, we suggest that end users of this reference content consult the appropriate literature to help guide their specific sample preparation decisions. A non-exhaustive list of this literature can be found in the references (Aly and Górecki, 2020; Andra et al., 2017; Dimpe and Nomngongo, 2016; Knoll et al., 2020; Núñez et al., 2017; Ribeiro et al., 2014; Sumner et al., 2007; Tulipani et al., 2013; Wasik et al., 2016). Ultimately, we encourage NTA researchers to include as many details as possible about both the sample(s) and their sample preparation methods, to support replication of their study and results.
Sample Information
Although the complete chemical composition of a sample cannot be known a priori, researchers can use information about the sample itself to guide their investigation and develop hypotheses about the likely detectable chemical space (e.g., volatile chemicals in an air sample, lipophilic chemicals in a blubber sample). NTA researchers should provide a complete description of all sample information relevant to the study’s objectives and conclusions, for example: the sample type, location and date of collection, pertinent conditions during collection (e.g., weather conditions for environmental samples), preexisting knowledge about the sample condition (e.g., adulterated vs. authentic for a food sample), and the amount of sample collected. Sample replication should also be carefully detailed (e.g., collection of a single composite sample vs. collection of individual field replicates).
Sample Preparation
Pre-Extraction. Many sampling techniques, particularly those that provide in-situ enrichment (e.g., passive sampling, biomonitoring), are selective and can introduce bias into the data, and thus should be considered in the sample preparation workflow when describing method performance (Menger et al., 2020). Even simple techniques such as grab sampling can influence NTA results, as factors including the time of collection and the material of the sample container can impact observed sample chemical composition. Storage conditions (container material, temperature, length of time) may also affect chemical composition and NTA results. Additionally, all steps used to prepare samples for extraction, such as filtration, centrifugation, freeze drying, or addition of standards, should be clearly described. Replication and sample splitting should also be carefully detailed.
Extraction/Enrichment. Extraction methods should be clearly described with enough information provided to allow replication of the method. Some of the common preparation techniques utilized in environmental, biological, and food chemistry applications include solid phase (micro)extraction (SPE/SPME), dispersive solid phase (micro)extraction (DSPE/DSPME), liquid-liquid extraction (LLE), liquid-phase microextraction (LPME) techniques, pressurized liquid extraction (PLE), stir bar sorptive extraction (SBSE), microwave-assisted extraction (MAE), vacuum-assisted evaporative concentration (VEC), and membrane extraction techniques (Aly and Górecki, 2020; Dimpe and Nomngongo, 2016; Knoll et al., 2020; Mechelke et al., 2019). Beyond these techniques, extracts are often further manipulated to clean-up or concentrate the samples. While many of these approaches are common between target and non-target studies, the latter may, in some cases, employ fewer clean-up steps, sacrificing the removal of matrix interferences in order to minimize losses in the chemical space of interest. Common extraction parameters that should be reported and described in NTA studies include sample volume/weight; extraction technique (e.g., PLE, sonication, QuEChERs [“quick, easy, cheap, effective, rugged, and safe”]); enrichment technique (e.g., SPE, evaporation); solvents; pH; buffers; extraction time; sorbent material and amount; pre-conditioning steps; reconstitution solvent and volume; centrifugation; filtration; addition of standards (Sumner et al., 2007).
Post-Extraction. Detailed information about sample handling prior to analysis should be provided (e.g., storage time and conditions, stability of any known or spiked analytes in the extracts).
Use of Blanks
A blank is a type of sample used to detect and distinguish artificially introduced contamination (due to sample handling, processing, instrumental analysis, etc.) from true sample content. In addition to clearly communicating the sample information and preparation methods, we encourage researchers to include blank samples that can enable assessment of background detections and possible sample contamination during sample collection and processing. At a minimum, researchers should describe in detail how blank samples were prepared and used to correct sample data. Researchers should strive to include any relevant details such as limits of detection or quantification (and how these were established), any comparison to peak areas in blanks that were used to exclude detections, any blank subtraction from peak areas or concentrations, how unknown blank features were aligned with sample features, etc.
There are a variety of possible types of blanks samples (e.g., field blank, travel blank, sample preparation blank, instrument blank), but these terms are often used and defined in different ways by different laboratories. Therefore, it is suggested that researchers describe in their publication the contamination that their blank samples include, as well as potential contamination which their blank samples do not include. For example, blank samples created in the laboratory will include potential contamination from the materials used for the selected sample extraction method, but will not include contamination that may have occurred during the sampling, transportation, and storage of samples – this should be stated explicitly in the publication. The number of blank samples created should be appropriate for the number of total samples. As a general guideline, the instrumental analysis of one blank for every 7-12 samples within a sequence is acceptable. However, smaller sample sets will benefit from a higher frequency, as multiple blank samples are required to assess the variability of contamination (e.g., a sample set with only 12 samples should have blanks run every 3-4 samples to give 3-4 blank injections).
| Table 1.2: Sample Information and Preparation Reporting | |
|---|---|
| Sample Preparation or Processing Aspect | |
| Sample information | Sample type; location and date of collection; conditions during collection; preexisting knowledge about the sample condition; amount of sample collected; replication/composite samples |
| Pre-extraction steps | Sampling technique and handling; replication/sample splitting; storage; filtering; centrifugation; freeze-drying; spiking standards (see below, QC Spikes & Samples) |
| Extraction/enrichment | Sample volume/weight; extraction technique (e.g., PLE); enrichment technique (e.g. SPE); solvents, pH, buffers, ionic strength; extraction time; sorbent material and amount; pre-conditioning steps; sample loading rate; eluent volume |
| Extract manipulation | Extract concentration/dilution; drying/evaporation; temperature; reconstitution solvent; centrifugation; syringe filtering; storage conditions prior to analysis; storage time; stability of known analytes in extract |
| Blanks | The process for creating blanks (including details of contamination included or not represented); the intended use of data acquired from blanks (e.g., blank subtraction, to establish limits of detection, etc.). |
QC Spikes and Samples
You are here: Reference Content > Methods > Study Design > QC Spikes and Samples
Quantitative evaluation and reporting of NTA sample preparation performance requires the use of standards (which are often referred to by a variety of terms, including internal standards, external standards, surrogates, isotope-labeled standards, etc.) to anchor the method and provide a reference point for informing the chemical space captured by the NTA. Spikes can be used for many purposes and are commonly used for quality control. For example, the recovery of spiked compounds is often used to evaluate extraction performance. They can also be used as chromatographic retention time markers, to assess mass accuracy, to determine potential matrix effects, examine method reproducibility, investigate chemometric method performance, and measure expected data quality.
Many recent studies have combined targeted and NTA methods, facilitating the quantitative, targeted measurement of specific chemicals (typically by use of isotope-labeled standards spiked prior to sample preparation/extraction steps) in tandem with non-targeted analysis (Albergamo et al., 2019; Black et al., 2019; Knolhoff et al., 2019; Munoz et al., 2018). This approach is encouraged, as it facilitates performance evaluation of all aspects of the method (sample preparation, instrumental method, data processing) as well as provides the potential for semi-quantification of unknowns identified through the NTA method. NTA studies should include some quantitative recovery results for a range of compounds to demonstrate the scope and limitations of their sample preparation method (i.e., what types of chemicals are being included/excluded).
NTA methods may also utilize isotopically labelled standards and/or standard additions of native compound standards as surrogates for quantification of method efficiencies of unknown/suspect compounds. These compounds may be used for semi-quantification of the unknown/suspect compounds.
Here, we define the specific terms “QC spike” and “QC sample” to describe the standard mixtures and samples, respectively, that can be used to support quality control and other performance assessments. Additional information on such assessments is provided in the section on QA/QC Metrics.
A QC spike is a set volume or mass of a solution of analytical standards (single or multi-component; native or isotope-labeled; of known identity and purity) that is added to the sample(s) either before sample preparation or immediately prior to sample analysis. The choice of standards to include in a QC spike will be application-specific, but in general, should represent compounds from multiple classes with varying polarity, hydrophobicity, and charge, and match the ionization mode used for analysis. Quantitative recoveries of the standards should be reported and used to inform the expected chemical space captured by the given sample preparation method.
The term QC sample encompasses multiple different sample types, including (but not limited to): QC spike controls (e.g., a set volume or mass of the same solvent used in the final sample extracts, with the QC spike added to it; for example see: Ng et al., 2020), spiked matrix samples (e.g., a sample consisting of the same matrix as the unknown samples, with the QC spike added to it; for example see: Knolhoff et al., 2016), or pooled matrix samples (e.g., a mixture of final extracts from multiple unknown samples; for example see: Koek et al., 2011). In the case of QC samples to which the QC spike has been added, the known analytes may be used to support comparisons across replicates, samples, or batches. For pooled matrix samples, researchers should select specific features (and describe the process for selection of those features) to support performance evaluation.
Although development and use of QC spikes and samples may be specific to a given study, researchers should clearly report the details of their chosen standards and sample types. Furthermore, given the wide variety of terminology currently in use by NTA researchers (and analytical chemistry researchers, as a whole), we suggest that if researchers use specific jargon (e.g., “surrogate” or “matrix control”), they should also provide sufficient accompanying detail so that the reader can fully understand the preparation and intended use of the standard mixtures and spiked/pooled samples. Specific information to report is summarized in Table 1.3 below.
| Table 1.3: QC Spikes & Samples Reporting | |
|---|---|
| QC Spikes & Samples Aspect | |
| Chemical standards |
|
| QC Spike |
|
| QC Samples (Preparation) |
|
| QC Samples (Usage) |
|
Examples of Reporting Experimental Design
Knolhoff et al. 2019 serves as a model study for approaching the evaluation of an NTA sample preparation method. The study investigated best practices aimed to optimize compound detection and data quality. Sample preparation methods, chromatographic gradient length, ionization mode, and resolving power were tested to determine optimal conditions that provide both the largest number of detected compounds and the best data quality.
Albergamo et al. 2019 is a good example of a study that utilized a suite of 128 isotopically labelled standards spiked at the beginning of sample preparation to track recoveries and normalize peak intensities for the NTA-identified features. Discussion of which isotopically labelled standards were detected during analysis was able to inform the types of compounds not captured with this particular sample preparation method. However, because a single set of internal standards are spiked at the beginning of sample preparation, it is not possible with this approach to differentiate between losses due to sample preparation versus matrix effects during ionization. Overall, although this approach is still only semi-quantitative, quantifying NTA-identified compounds with isotopically labelled surrogates appears, at this time, to be the best available approach to assess sample preparation efficiencies for unknown/suspect compounds identified.
Munoz et al. 2019 is a good example of a paper that compared suspect screening results from different sample preparation methods. They used spikes of native compounds and isotopically labeled standards for quantification of some compounds, but relied on semi-quantitative and qualitative approaches for others.
References & Other Relevant Literature
Albergamo, V., Schollee, J. E., Schymanski, E. L., Helmus, R., Timmer, H., Hollender, J., & de Voogt, P. (2019). Nontarget Screening Reveals Time Trends of Polar Micropollutants in a Riverbank Filtration System. Environmental Science & Technology, 53(13), 7584-7594. doi:10.1021/acs.est.9b01750
Aly, A. A., & Górecki, T. (2020). Green Approaches to Sample Preparation Based on Extraction Techniques. Molecules, 25(7), 1719. doi:10.3390/molecules25071719
Andra, S. S., Austin, C., Patel, D., Dolios, G., Awawda, M., & Arora, M. (2017). Trends in the application of high-resolution mass spectrometry for human biomonitoring: An analytical primer to studying the environmental chemical space of the human exposome. Environment International, 100, 32-61. doi:10.1016/j.envint.2016.11.026
Barzen-Hanson, K. A., Roberts, S. C., Choyke, S., Oetjen, K., McAlees, A., Riddell, N., . . . Field, J. A. (2017). Discovery of 40 Classes of Per- and Polyfluoroalkyl Substances in Historical Aqueous Film-Forming Foams (AFFFs) and AFFF-Impacted Groundwater. Environmental Science & Technology, 51(4), 2047-2057. doi:10.1021/acs.est.6b05843
Black, G. P., Anumol, T., & Young, Thomas M. (2019). Analyzing a broader spectrum of endocrine active organic contaminants in sewage sludge with high resolution LC-QTOF-MS suspect screening and QSAR toxicity prediction. Environmental Science: Processes & Impacts, 21(7), 1099-1114. doi:10.1039/C9EM00144A
Blaženović, I., Kind, T., Torbašinović, H., Obrenović, S., Mehta, S. S., Tsugawa, H., . . . Fiehn, O. (2017). Comprehensive comparison of in silico MS/MS fragmentation tools of the CASMI contest: database boosting is needed to achieve 93% accuracy. Journal of Cheminformatics, 9(1), 32. doi:10.1186/s13321-017-0219-x
Clara, M., Windhofer, G., Hartl, W., Braun, K., Simon, M., Gans, O., . . . Chovanec, A. (2010). Occurrence of phthalates in surface runoff, untreated and treated wastewater and fate during wastewater treatment. Chemosphere, 78(9), 1078-1084. doi:10.1016/j.chemosphere.2009.12.052
Dimpe, K. M., & Nomngongo, P. N. (2016). Current sample preparation methodologies for analysis of emerging pollutants in different environmental matrices. TrAC Trends in Analytical Chemistry, 82, 199-207. doi:10.1016/j.trac.2016.05.023
Gauglitz, J. M., Aceves, C. M., Aksenov, A. A., Aleti, G., Almaliti, J., Bouslimani, A., . . . Dorrestein, P. C. (2020). Untargeted mass spectrometry-based metabolomics approach unveils molecular changes in raw and processed foods and beverages. Food Chemistry, 302, 125290. doi:10.1016/j.foodchem.2019.125290
Jang, I., Lee, J. U., Lee, J. M., Kim, B. H., Moon, B., Hong, J., & Oh, H. B. (2019). LC-MS/MS Software for Screening Unknown Erectile Dysfunction Drugs and Analogues: Artificial Neural Network Classification, Peak-Count Scoring, Simple Similarity Search, and Hybrid Similarity Search Algorithms. Analytical Chemistry, 91(14), 9119-9128. doi:10.1021/acs.analchem.9b01643
Knolhoff, A. M., Kneapler, C. N., & Croley, T. R. (2019). Optimized chemical coverage and data quality for non-targeted screening applications using liquid chromatography/high-resolution mass spectrometry. Analytica Chimica Acta, 1066, 93-101. doi:10.1016/j.aca.2019.03.032
Knolhoff, A. M., Premo, J. H., & Fisher, C. M. (2021). A Proposed Quality Control Standard Mixture and Its Uses for Evaluating Nontargeted and Suspect Screening LC/HR-MS Method Performance. Analytical Chemistry, 93(3), 1596-1603. doi:10.1021/acs.analchem.0c04036
Knolhoff, A. M., Zweigenbaum, J. A., & Croley, T. R. (2016). Nontargeted Screening of Food Matrices: Development of a Chemometric Software Strategy To Identify Unknowns in Liquid Chromatography–Mass Spectrometry Data. Analytical Chemistry, 88(7), 3617-3623. doi:10.1021/acs.analchem.5b04208
Knoll, S., Rosch, T., & Huhn, C. (2020). Trends in sample preparation and separation methods for the analysis of very polar and ionic compounds in environmental water and biota samples. Analytical and Bioanalytical Chemistry, 412(24), 6149-6165. doi:10.1007/s00216-020-02811-5
Koek, M. M., van der Kloet, F. M., Kleemann, R., Kooistra, T., Verheij, E. R., & Hankemeier, T. (2011). Semi-automated non-target processing in GC x GC-MS metabolomics analysis: applicability for biomedical studies. Metabolomics, 7(1), 1-14. doi:10.1007/s11306-010-0219-6
Krauss, M., Singer, H., & Hollender, J. (2010). LC–high resolution MS in environmental analysis: from target screening to the identification of unknowns. Analytical and Bioanalytical Chemistry, 397(3), 943-951. doi:10.1007/s00216-010-3608-9
Mechelke, J., Longree, P., Singer, H., & Hollender, J. (2019). Vacuum-assisted evaporative concentration combined with LC-HRMS/MS for ultra-trace-level screening of organic micropollutants in environmental water samples. Analytical and Bioanalytical Chemistry, 411(12), 2555-2567. doi:10.1007/s00216-019-01696-3
Mejia-Avendaño, S., Munoz, G., Vo Duy, S., Desrosiers, M., Benoît, P., Sauvé, S., & Liu, J. (2017). Novel Fluoroalkylated Surfactants in Soils Following Firefighting Foam Deployment During the Lac-Megantic Railway Accident. Environmental Science & Technology, 51(15), 8313-8323. doi:10.1021/acs.est.7b02028
Menger, F., Gago-Ferrero, P., Wiberg, K., & Ahrens, L. (2020). Wide-scope screening of polar contaminants of concern in water: A critical review of liquid chromatography-high resolution mass spectrometry-based strategies. Trends in Environmental Analytical Chemistry, 28, e00102. doi:10.1016/j.teac.2020.e00102
Munoz, G., Ray, P., Mejia-Avendaño, S., Vo Duy, S., Tien Do, D., Liu, J., & Sauvé, S. (2018). Optimization of extraction methods for comprehensive profiling of perfluoroalkyl and polyfluoroalkyl substances in firefighting foam impacted soils. Analytica Chimica Acta, 1034, 74-84. doi:10.1016/j.aca.2018.06.046
Ng, B., Quinete, N., & Gardinali, P. R. (2020). Assessing accuracy, precision and selectivity using quality controls for non-targeted analysis. Science of the Total Environment, 713, 136568. doi:10.1016/j.scitotenv.2020.136568
Núñez, M., Borrull, F., Pocurull, E., & Fontanals, N. (2017). Sample treatment for the determination of emerging organic contaminants in aquatic organisms. TrAC Trends in Analytical Chemistry, 97, 136-145. doi:10.1016/j.trac.2017.09.007
Oberacher, H., Reinstadler, V., Kreidl, M., Stravs, M. A., Hollender, J., & Schymanski, E. L. (2018). Annotating Nontargeted LC-HRMS/MS Data with Two Complementary Tandem Mass Spectral Libraries. Metabolites, 9(1), 3. doi:10.3390/metabo9010003
Peter, K. T., Tian, Z., Wu, C., Lin, P., White, S., Du, B., . . . Kolodziej, E. P. (2018). Using high-resolution mass spectrometry to identify organic contaminants linked to urban stormwater mortality syndrome in coho salmon. Environmental Science & Technology, 52(18), 10317-10327. doi:10.1021/acs.est.8b03287
Phillips, K. A., Yau, A., Favela, K. A., Isaacs, K. K., McEachran, A., Grulke, C., . . . Wambaugh, J. F. (2018). Suspect Screening Analysis of Chemicals in Consumer Products. Environmental Science & Technology, 52(5), 3125-3135. doi:10.1021/acs.est.7b04781
Raynie, D. E. (2018). The Vital Role of Blanks in Sample Preparation. LCGC North America, 36(8), 494-497. Retrieved from https://www.chromatographyonline.com/view/vital-role-blanks-sample-preparation
Ribeiro, C., Ribeiro, A. R., Maia, A. S., Goncalves, V. M., & Tiritan, M. E. (2014). New trends in sample preparation techniques for environmental analysis. Critical Reviews in Analytical Chemistry, 44(2), 142-185. doi:10.1080/10408347.2013.833850
Schymanski, E. L., Jeon, J., Gulde, R., Fenner, K., Ruff, M., Singer, H. P., & Hollender, J. (2014). Identifying small molecules via high resolution mass spectrometry: Communicating confidence. Environmental Science & Technology, 48(4), 2097-2098. doi:10.1021/es5002105
Schymanski, E. L., Singer, H. P., Slobodnik, J., Ipolyi, I. M., Oswald, P., Krauss, M., . . . Hollender, J. (2015). Non-target screening with high-resolution mass spectrometry: critical review using a collaborative trial on water analysis. Analytical and Bioanalytical Chemistry, 407(21), 6237-6255. doi:10.1007/s00216-015-8681-7
Strynar, M., Dagnino, S., McMahen, R., Liang, S., Lindstrom, A., Andersen, E., . . . Ball, C. (2015). Identification of Novel Perfluoroalkyl Ether Carboxylic Acids (PFECAs) and Sulfonic Acids (PFESAs) in Natural Waters Using Accurate Mass Time-of-Flight Mass Spectrometry (TOFMS). Environmental Science & Technology, 49(19), 11622-11630. doi:10.1021/acs.est.5b01215
Sumner, L. W., Amberg, A., Barrett, D., Beale, M. H., Beger, R., Daykin, C. A., . . . Viant, M. R. (2007). Proposed minimum reporting standards for chemical analysis Chemical Analysis Working Group (CAWG) Metabolomics Standards Initiative (MSI). Metabolomics, 3(3), 211-221. doi:10.1007/s11306-007-0082-2
Tulipani, S., Llorach, R., Urpi-Sarda, M., & Andres-Lacueva, C. (2013). Comparative analysis of sample preparation methods to handle the complexity of the blood fluid metabolome: when less is more. Anal Chem, 85(1), 341-348. doi:10.1021/ac302919tWasik, A., Kot-Wasik, A., & Namiesnik, J. (2016). New Trends in Sample Preparation Techniques for the Analysis of the Residues of Pharmaceuticals in Environmental Samples. Current Analytical Chemistry, 12(4), 280-302. doi:10.2174/1573411012666151009194833